Kibana
Create dashboards with Awell
Use Awell's analytics tool, Kibana, for dashboarding & data visualization
This small tutorial will show you how to create data dashboards with collected data in Kibana.
Note: if you haven't used Kibana before, we can recommend to also read Kibana introduction.
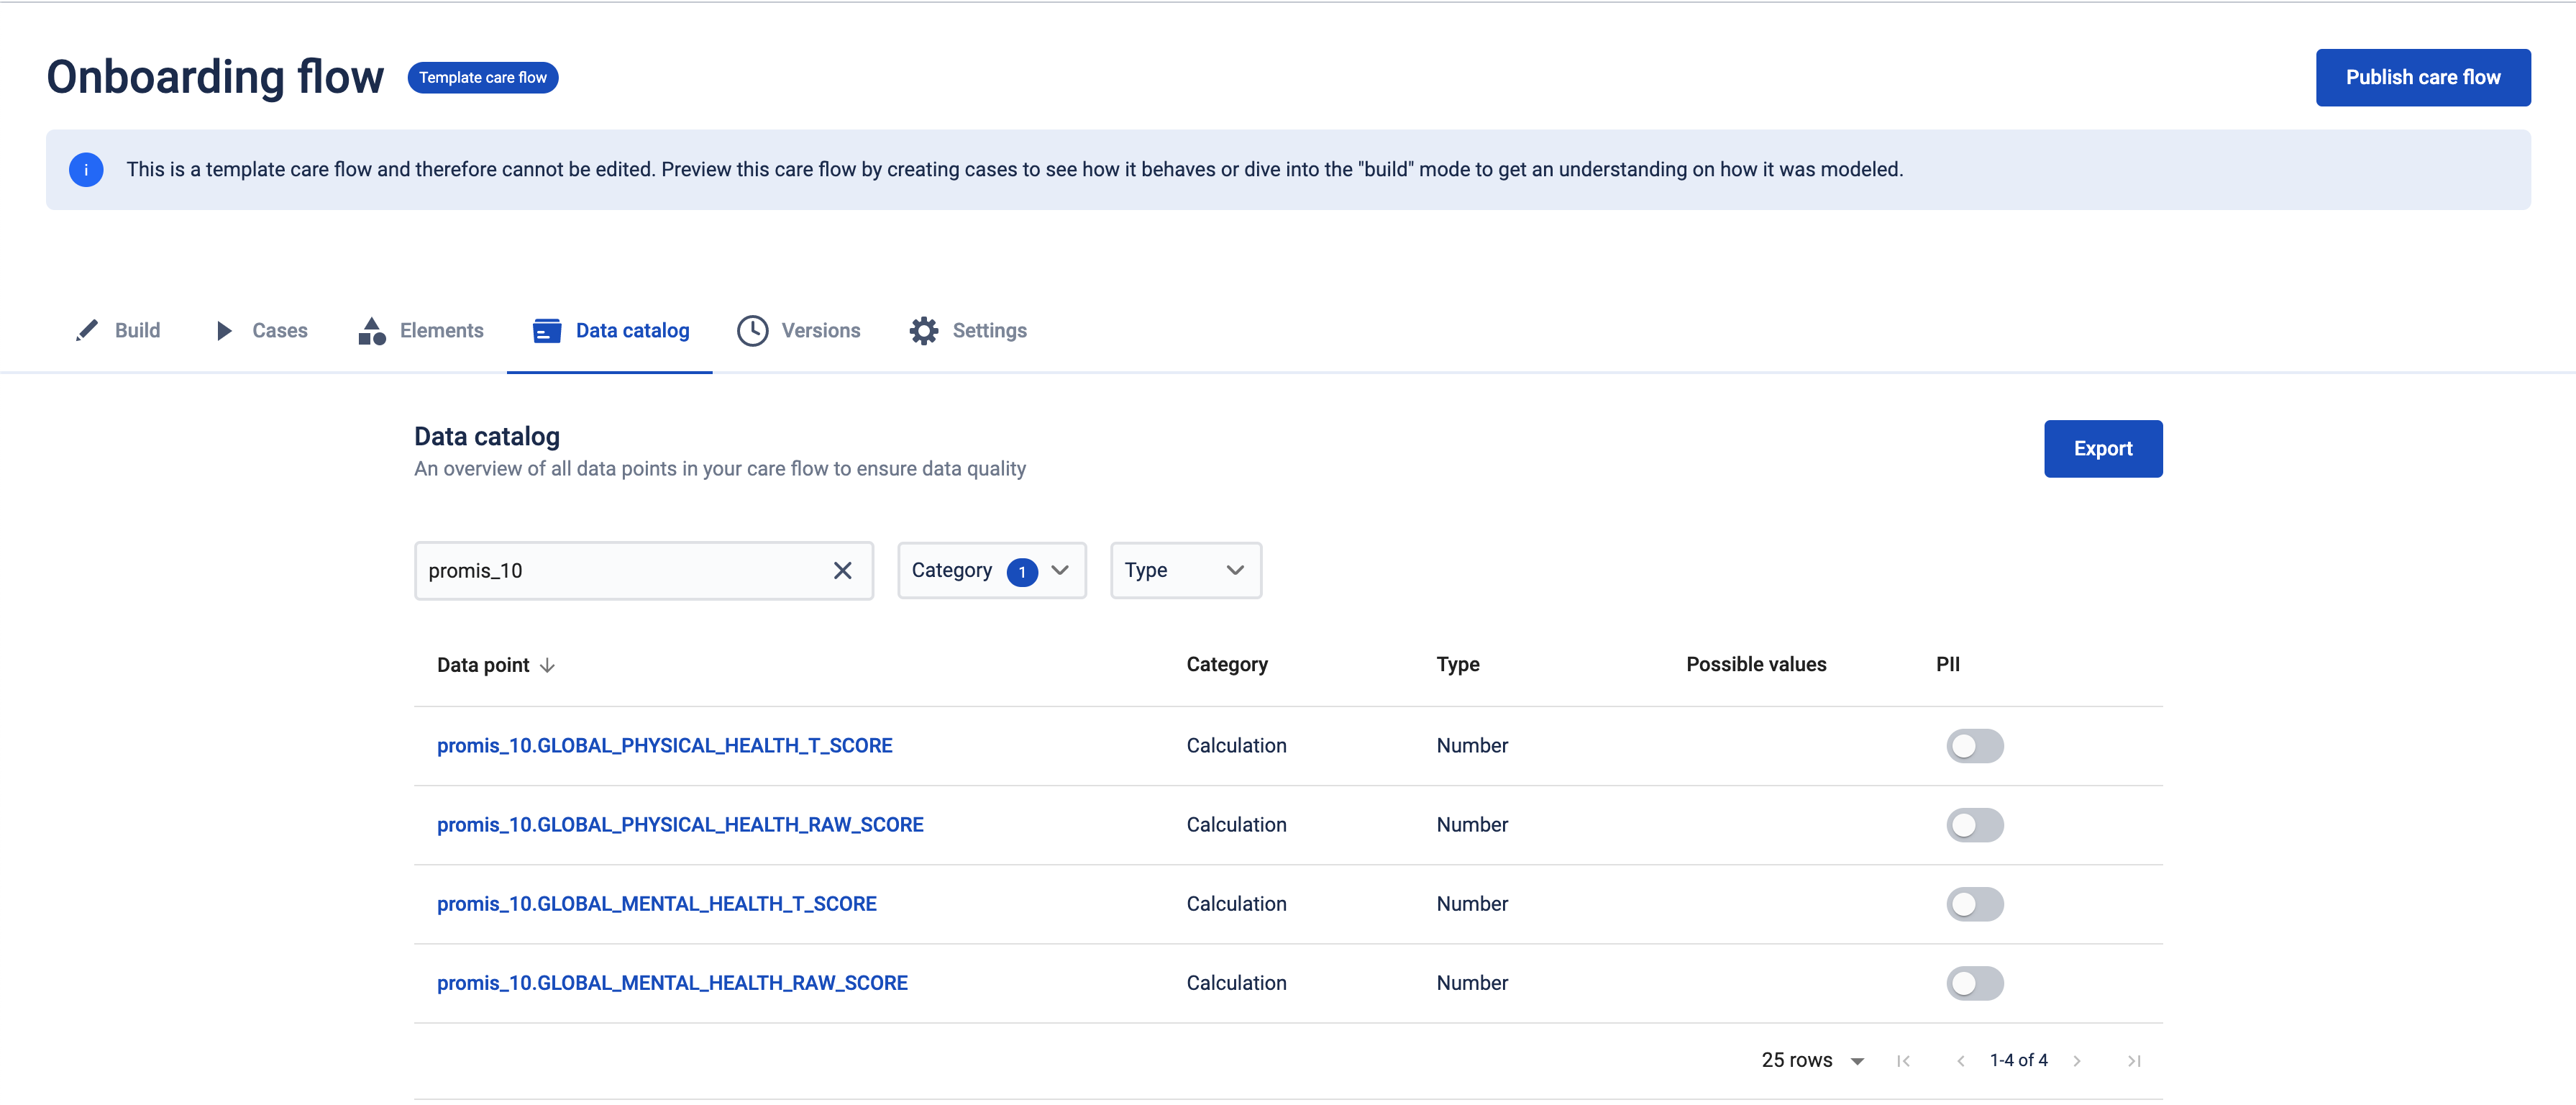
Explore the data catalog
When starting to build data visualizations, the data catalog in the Awell platform is often a good place to start.
The data catalog lists all the data points that are collected in the lifecycle of a care flow and that can be used to create data visualizations. This means it is a useful resource to define which visualizations you can and would like to create (more info about the data catalog can be found here).
In this example, we will look at the data catalog of the Onboarding flow template that is available in all accounts.
The onboarding care flow collects the PROMIS-10 patient reported outcomes through forms that then feed into the calculation of the PROMIS-10 score. Notice the data point keys associated with the different results of the score - they will be used later in this tutorial.
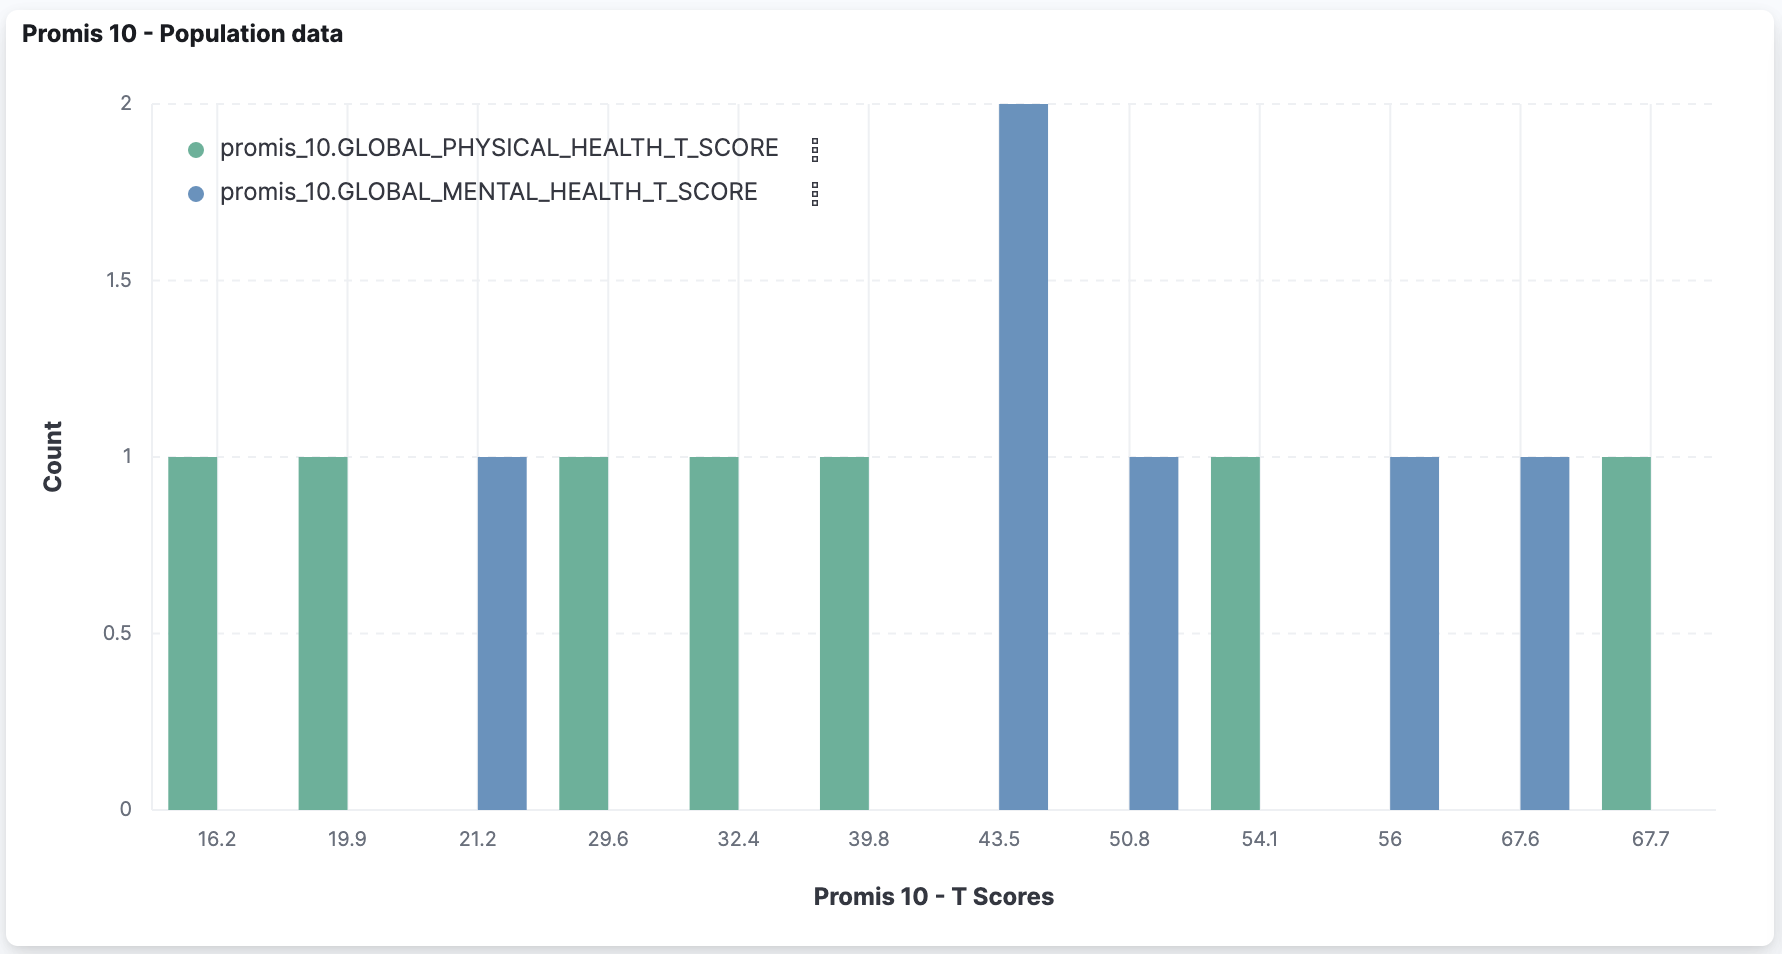
Create population dashboard
Moving to Kibana, we can now create a dashboard that tracks the distribution of the physical and mental health T Scores for the PROMIS-10 calculation across a population.
Note: As mentioned on Kibana introduction, you will only be able to create new dashboards in your dedicated Kibana space. The 'Care Flow Metrics' space is read-only.
To create this dashboard we simply need to:
- Query the
orchestration-datapointdataview that contains all the collected data. - Filter on the field
data_point_definition.qualified_keyto select only values collected forpromis_10.GLOBAL_PHYSICAL_HEALTH_T_SCOREandpromis_10.GLOBAL_MENTAL_HEALTH_T_SCORE. - Group by value to show the distribution of physical and mental health score across a population
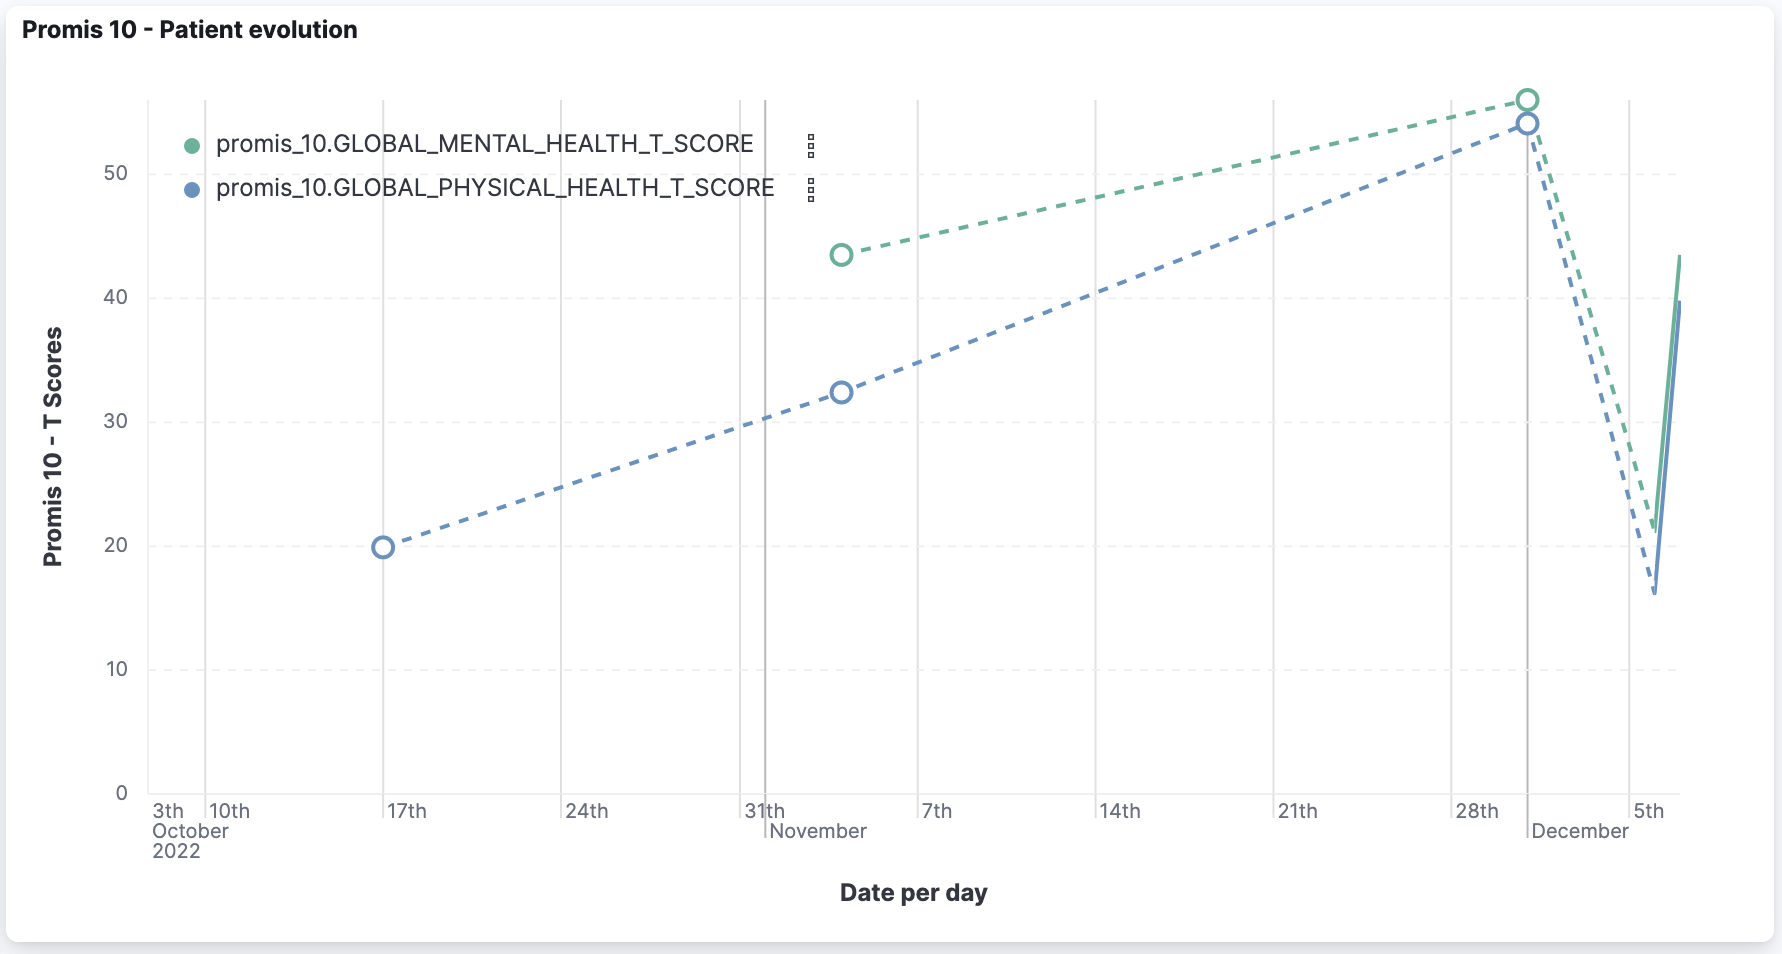
Create patient centric dashboard
Using Kibana, we can also create a dashboard that tracks the evoluation of the physical and mental health T Scores for a specific patient.
To create this dashboard we simply need to:
- Query the
orchestration-datapointindex that contains all the collected data. - Filter on the field
data_point_definition.qualified_keyto select only values collected forpromis_10.GLOBAL_PHYSICAL_HEALTH_T_SCOREandpromis_10.GLOBAL_MENTAL_HEALTH_T_SCORE. - Filter on the
data_set_idto restrict the results to a given care flow / patient. - Show the evaluation over time for the results